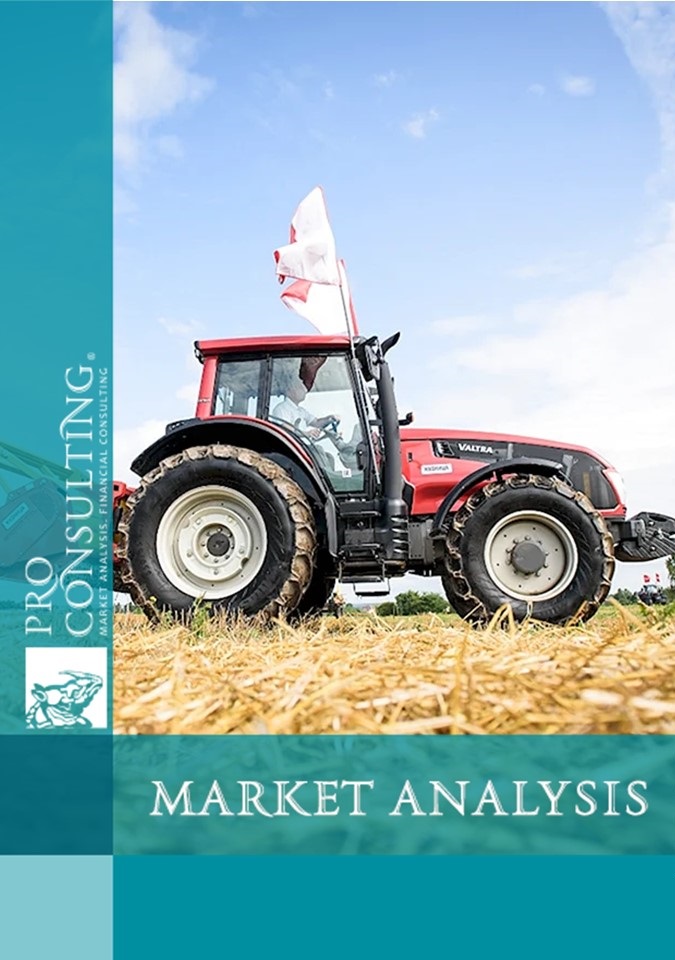
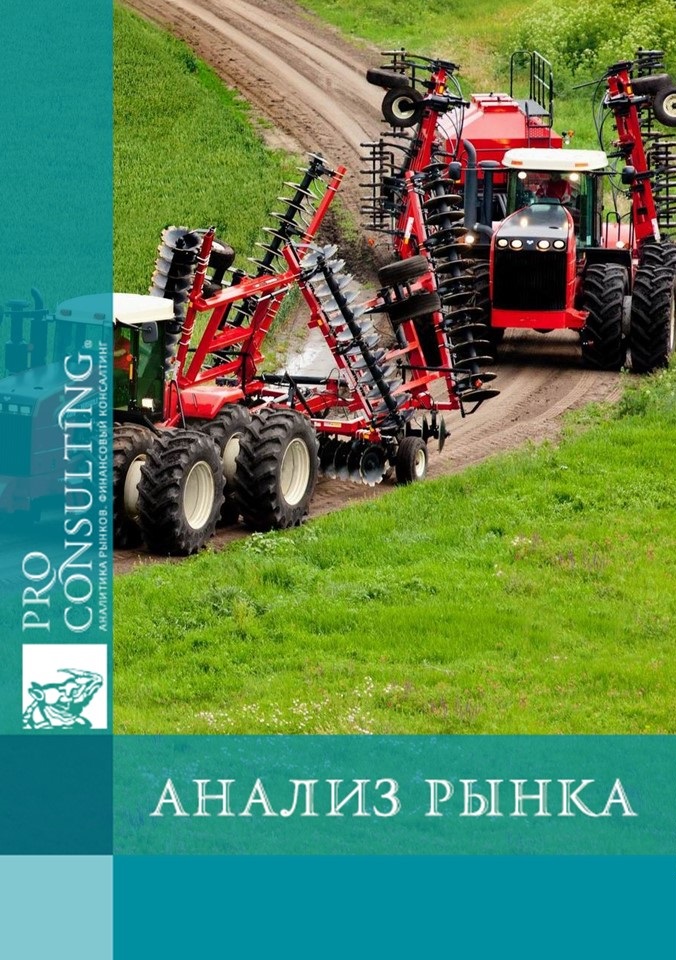
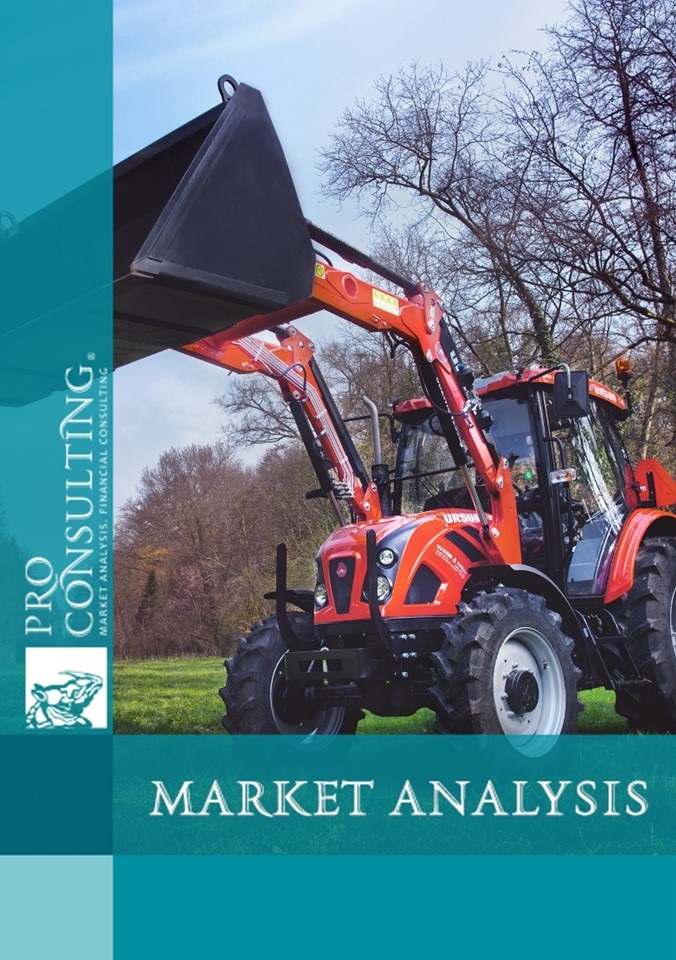
Market research of agricultural tractors with a capacity of 30-120 horsepower in Ukraine. 2019 year
| Date of Preparation: | October 2019 year |
| Number of pages: | 28, Arial, 1 interval, 10 pt |
| Graphs and charts: | 20 |
| Tables: | 7 |
| Payment method: | prepayment |
| Production method: | e-mail or courier electronically or in printed form |
| Report language: | russian |
- This report can be updated and customized based on your business goals; you can also purchase part of report (no less than 50%) at a more affordable price
- Failed to find your market research report? - contact us
- You can also order feasibility study and business plan for your business idea


Detailed contents:
1. Trends Analysis in the of low-power tractors market in Ukraine
2. Overall market indicators in 2015-5 months 2019.
* Market capacity (production, import, export) in 2015-5 months 2019.
* Dynamics of the new and used tractors import in 2015-5 months 2019.
* Dynamics of tractors purchase by agricultural enterprises in 2015-2018.
3. Major market operators
3.1. List of major market operators and their description (importers and, if available, manufacturers)
3.2. Structuring of operators (by tractor power, import countries, trademarks, import prices and price segments)
3.3. Market shares of major market operators
4. Import of low power tractors in 2015-5 months 2019 (volumes, structure by power, TM, prices, geography of deliveries by country, share of importers; by used - total volume only)
5. Price and pricing in the market
* Import prices (by major importers, TM and power)
* Average purchase prices by region and power (according to official statistics)
* Sellers' prices (according to catalogs)
6. Conclusions, forecast trends and market development indicators in 2019-2022
List of Tables:
1. New agricultural tractors in Ukraine Market capacity in 2015-5 months 2019, in kind, units
2. New agricultural tractors purchase Dynamics by agricultural enterprises in 2015-2018, in kind, units
3. New agricultural tractors purchase Dynamics by agricultural enterprises according to the customs classifier in 2015-2018, in kind, units
4. Structuring of operators by tractors power, import countries, trademarks, import price, USD/unit
5. Agricultural tractors (new) Import in Ukraine in 2015-5 months 2019, in kind, units
6. Average import prices for new tractors in Ukraine, ths.USD for 1 unit.
7. New agricultural tractors Purchase by agricultural enterprises in 2018, in kind, units
List of graphs and charts:
1. Dynamics of real GDP of Ukraine in 2014-2018, billion USD
2. Dynamics of real GDP of Ukraine per capita in 2014-2018, USD
3. Agricultural crops sown area of in Ukraine in 2014-2018, thousand hectares
4. Crop production volume in Ukraine in 2014-2018, thousand tons
5. The share of agriculture in the structure of GDP of Ukraine,%
6. Forecast of the agriculture share dynamics in the structure of GDP of Ukraine (realistic) for 2019-2021,%
7. Forecast of the agriculture share dynamics in the structure of GDP of Ukraine in case of the land market lunch for 2019-2021,%
8. The share of agricultural products exports in total volume of exports from Ukraine,%
9. Number of farms in Ukraine as of January 1, 2014-2019, pcs
10. New agricultural tractors Market capacity in Ukraine in 2015-5 months 2019, in kind, units
11. Dynamics of agricultural tractors (new) import in Ukraine in 2015-5 months 2019, in kind, units
12. Dynamics of agricultural tractors (used) import in Ukraine in 2015-5 months 2019, in kind, units
13. Major market operators Shares (agricultural machinery importers) in Ukraine in 2018, in kind,%.
14. Import structure (by type of tractor) in 2015 - 5 months 2019, in kind, units
15. Import structure of new tractors by power in 2015 and 2018; in 5 months 2018 and 5 months. 2019, in kind,%
16. Structure of new tractors imports by brand in 2015 and 2018; in 5 months 2018 and 5 months 2019, in kind,%
17. Structure of new tractors imports by country in 2015 and 2018; in 5 months 2018 and 5 months 2019, in kind,%
18. Proportions of new tractors importers in 2015 and 2018; in 5 months 2018 and 5 months 2019, in monetary terms,%
19. Proportions of new tractors importers in 2015 and 2018; in 5 months 2018 and 5 months 2019, in kind,%
20. Forecast capacity of the low-power tractors market (34-122 hp) in Ukraine in 2019-2022, units
