Market research report on plastic products in Ukraine. 2023 year
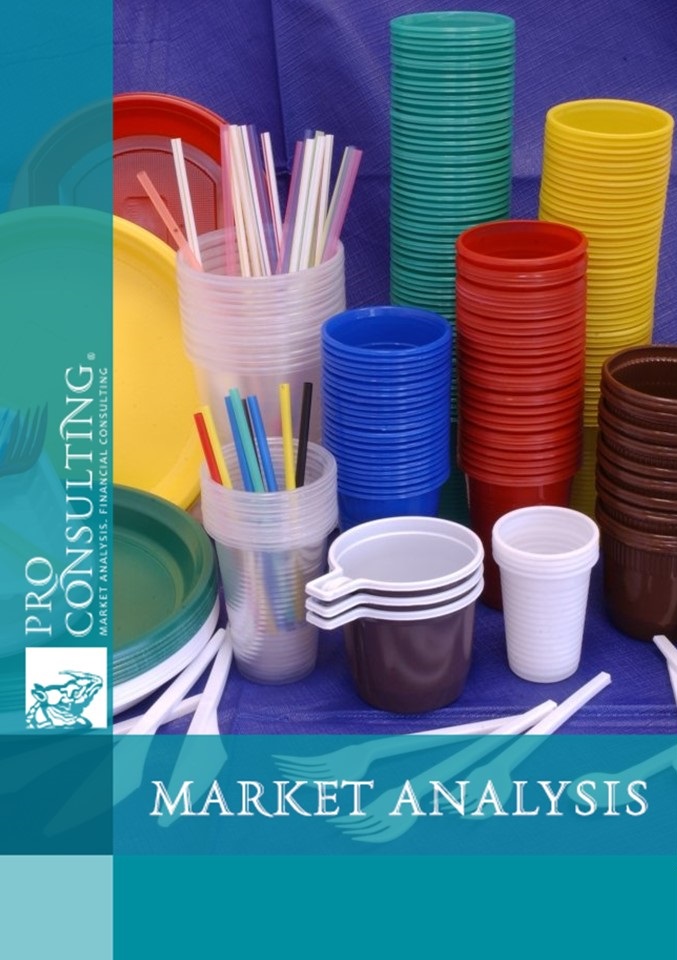
| Date of Preparation: | July 2023 year |
| Number of pages: | 40, Arial, 1 interval, 10 pt |
| Graphs and charts: | 11 |
| Tables: | 22 |
| Payment method: | prepayment |
| Production method: | e-mail or courier electronically or in printed form |
| Report language: | ukrainian, russian, english |
- This report can be updated and customized based on your business goals; you can also purchase part of report (no less than 50%) at a more affordable price
- Failed to find your market research report? - contact us
- You can also order feasibility study and business plan for your business idea


Detailed contents:
1. General characteristics of the market
1.1. Analysis of market development trends (factors of influence, development problems)
1.2. General market indicators, calculation of market capacity in 2019-2022 (production + import - export)
1.3. Evaluation of the shadow segment on the market
1.4. Market segmentation and structuring (by types, origin)
2. Main market operators (manufacturers and importers)
2.1. List of the main market operators and their structuring (general information, types of activities and specialization; product groups, trademarks and assortment; regional representation)
2.2. Market shares of the main market operators
2.3. Degree of competition and risks. Factor analysis of competitors' market shares
3. Production of products in 2019-2022.
3.1. Dynamics of production in quantitative indicators
3.2. Shares of manufacturers
4. Foreign trade and foreign trade
4.1. Export of products from Ukraine in 2019-2022 (Volumes, structure, geography, shares of exporters)
4.2. Import of products to Ukraine in 2019-2022 (Volumes, structure, geography, shares of importers)
4.3. The volume and structure of imports from the russia and belarus
4.3.1. The total volume of imports
4.3.2. The share of products imported from the russia and belarus
4.4. Import structuring
4.4.1. Selection of groups of mass consumption goods (largest volumes) and unique ones (highest price, specific products)
4.4.2. Structure by types of goods and raw materials (polymers)
4.5. Main importers
4.5.1. The list of companies with the largest volumes of imports and their structuring (types of activity and specialization; imported product groups, specifics of sales of such products; replacement of imports from the russia and belarus by imports from other countries in 2022)
4.5.2. Contact details of such companies
5. Market consumption analysis. Consumer preferences for the product, consumer portrait
6. Product sales channels (description and evaluation of the sales structure by channels)
7. Conclusions. Predictive market indicators
7.1. Conclusions and forecast trends of market development
7.2. Construction of market development hypotheses. Forecast indicators of market development in 2023-25
7.3. Recommendations for market development
7.4. Selection of the most promising product groups to replace imports from the russia and belarus
8. Investment attractiveness of the industry
8.1. SWOT analysis of the Customer's company on the market
List of Tables:
1. Investigated categories of plastic products
2. Assessment of the influence of factors on the market of plastic products
3. Volumes of the plastic goods market of Ukraine in kind and monetary indicators, 2021-2022, thousand tons, million UAH.
4. Dynamics of categories of goods by origin in 2021-2022, in natural indicators, thousand tons
5. Main operators on the market of plastic products in Ukraine by company revenues, UAH million.
6. List and description of the main operators on the market of plastic products in Ukraine
7. Geographical offices of the main operators in the market of plastic products
8. Structure of the market of plastic products by main operators during 2021-2022 by volume, thousand tons
9. Factor analysis of the largest companies in the market of plastic products
10. Production of the main categories of plastic goods in Ukraine in 2021-2022, in natural terms, thousand tons
11. The main manufacturers of plastic goods in Ukraine by category in 2021-2022,%
12. Main categories of goods by the largest importing countries
13. Main categories of goods by the largest exporting countries in 2019-2022, thousand tons
14. The main importers of plastic products to Ukraine by product category in 2019-2022,%
15. The main types of plastic goods imported from russia and belarus, 2019-2022.
16. The main importers of products from russia and belarus by customer categories
17. Origin of products imported from russia and belarus in 2019-2022.
18. List of companies with the largest volumes of imports on the market of plastic goods and their structuring
19. Contact data of companies with the largest volumes of imports on the market of plastic goods
20. Advantages and disadvantages of sales channels
21. The most promising product groups for replacing imports from russia and belarus
22. SWOT – analysis of the Customer's company on the market
List of graphs and charts:
1. Dynamics of production of plastic goods in 2019-2022 in natural terms, thousand tons
2. Dynamics of production of plastic goods in 2019-2022 in monetary terms, billion UAH.
3. Dynamics of export of plastic products from Ukraine in 2019-2022, thousand tons
4. Geography of export of plastic products from Ukraine 2019-2022,%
5. Dynamics of import of plastic products to Ukraine in 2019-2022, thousand tons
6. Geography of import of plastic products to Ukraine 2019-2022,%
7. Total import of plastic products from the russia, 2019-2022, thousand tons
8. Total import of plastic products from the belarus, 2019-2022, thousand tons
9. Sales channels by number of intermediaries
10. Forecast of the development of the market capacity of plastic products in 2023-2025, thousand tons
11. Forecast of the development of the market capacity of plastic products in 2023-2024, UAH billion.

