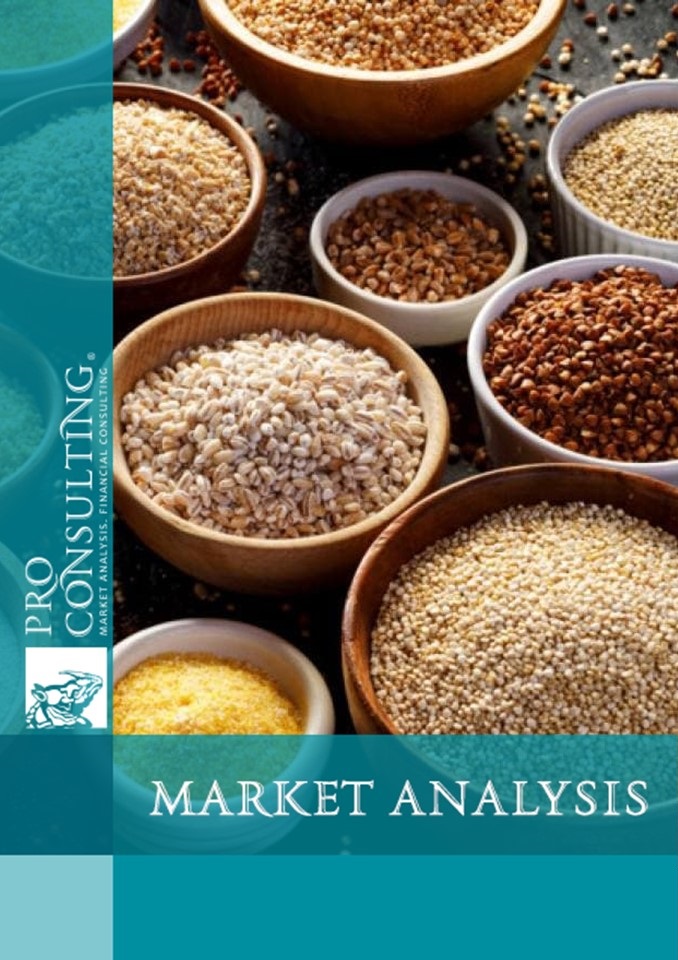
Ukrainian groats market report. 2019
| Date of Preparation: | November 2019 year |
| Number of pages: | 13, Arial, 1 spacing, 10 pt |
| Graphs and charts: | 7 |
| Tables: | 2 |
| Payment method: | prepayment |
| Production method: | e-mail or courier electronically or in printed form |
| Report language: | ukrainian |
- This report can be updated and customized based on your business goals; you can also purchase part of report (no less than 50%) at a more affordable price
- Failed to find your market research report? - contact us
- You can also order feasibility study and business plan for your business idea


Detailed contents:
1. Production of cereals in 2017-2018 and 9 months 2019 - estimate
1.1. Total production by cereals types in quantitative terms (taking into account the shadow segment)
2. Major market operators (manufacturers)
2.1. The list of the major market operators - TOP-10 operators
2.2. Major Market Operators Market Share by Type of Cereals (Based on Production Data)
2.3. Competition Degree and development risks in Ukraine's cereals market
3. Conclusions on the results of the research
List of Tables:
1. TOP grain market operators in Ukraine Production volume and shares in 2017-9 months 2019
2. Analysis of the operators' market share dynamics from 2017 to 2018
List of graphs and charts:
1. Dynamics of cereals and coarse grinding flours from wheat and spelt Production by market operators in Ukraine in 2017-9 months 2019, in kind, thousand tons
2. Geographical structure of cereals and coarse grinding flours from wheat and spelt production by market operators in Ukraine in 2018, in kind, thousand tons,%
3. Dynamics of cereals, coarse grinding flours from oat, corn, rice, rye, barley and other grain (except wheat) production by market operators in Ukraine in 2017 - 9 months 2019, in kind, thousand tons
4. Production Structure by types of cereals in Ukraine in 2017, in kind, thousand tons,%
5. Production Structure by types of cereals in Ukraine in 2018, in in kind, thousand tons,%
6. Production Dynamics of flattened cereal grains, processed into flakes, collapsed, crushed (except rice) by market operators in Ukraine in 2017-9 months 2019, in kind, thousand tons
7. Production Structure of flattened cereal grains, processed into flakes, collapsed, crushed (except rice) by market operators in Ukraine in 2018-9 months. 2019, in kind, thousand tons
