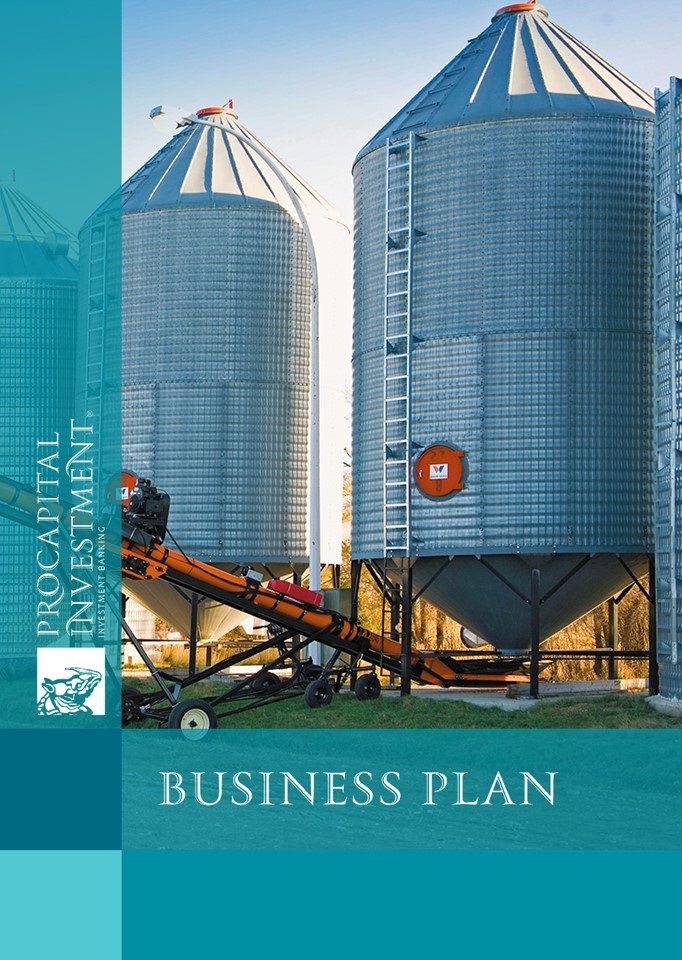
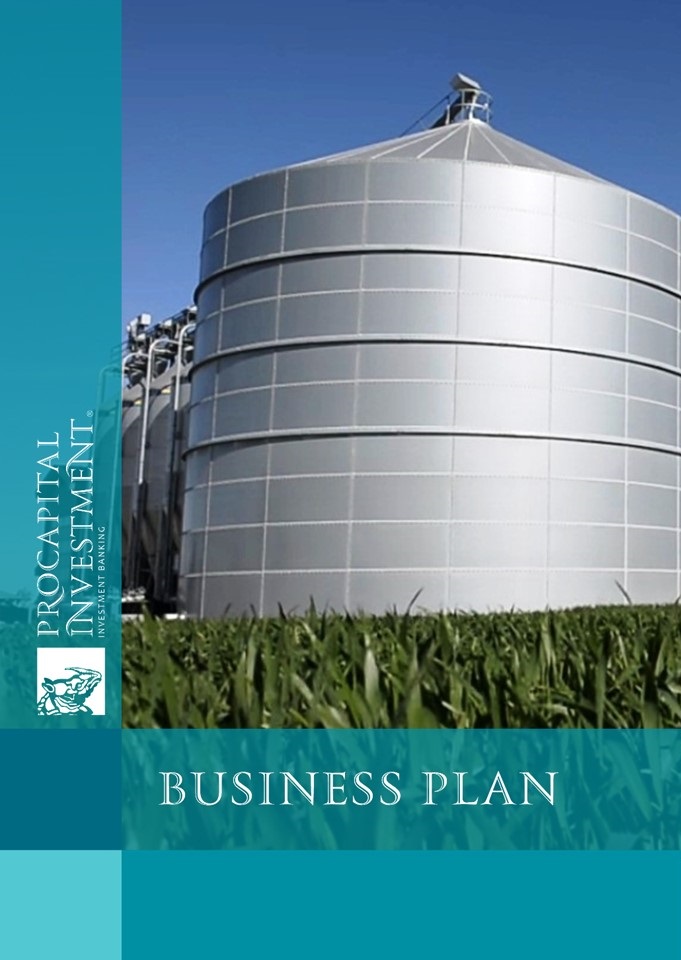
Business plan of elevator at 53,000 tonnes of grain storage
| Date of Preparation: | September 2015 year |
| Number of pages: | 5 pages, including 21 applications, 24 tables, 25 figures (document prepared in Russian) |
| Payment method: | prepayment |
| Production method: | digital in Word + financial model in Excel |
- This project can be updated with your volumes, period and location
- You can order business plan for other project - сontact us
- You can also order market research for your business


The concept of the project:
<p
Content:
1. PROJECT SUMMARY
2. PROJECT
2.1. PROJECT DESCRIPTION
2.1.1. Goals and objectives of the Project
2.1.2. Sources of funding for the project. Areas of investment
2.1.3. Network Diagram implementation and financing of the Project
2.2. PRODUCTION PROCESS PROJECT
2.2.1. Location of the Project, the circuit area
2.2.2. The manufacturing process
2.2.2.1. The description of technology of cultivation of crops
2.2.2.2. Description grain storage technology
2.2.3. Characteristics of production capacity
2.2.3.1. Agricultural machinery
2.2.3.2. Elevator
2.2.4. Characteristics of products
2.2.4.1. Cereals
2.2.5. Source of raw materials
2.2.5.1. Cereals
2.2.6. Cost of production
2.2.6.1. Cost of cultivation of grain
2.2.6.2. Cost of the work elevator
2.2.7. Footage. Personnel policy
2.2.8. Laws and regulations affecting
2.2.8.1. Cereals
2.2.8.2. Taxation of Agricultural Producers
2.3. Grains Market in Ukraine
2.3.1. Overview of crops
2.2. GROWTH DYNAMICS AND IMPLEMENTATION OF GRAINS
2.3.3. The main producers of grains market
2.3.4. Foreign trade in grains market of Ukraine
2.3.5. Price dynamics and changes in the value of the market for cereals in Ukraine
2.3.6. Forecast of the industry and the investment attractiveness of Ukraine's grain
2.4. FINANCIAL ASSESSMENT PROJECT
2.4.1. Prerequisites for the calculations and reasoning
2.4.2. The sales forecast for the Project
2.4.3. Generation of profits for the Project
2.4.4. Forecast cash flow for the Project
2.4.5. The breakeven point for the Project
2.4.6. Justification structuring of credit (grace period. Repayment schedule)
2.4.7. Justification loan servicing capabilities. Debt service ratio
2.4.8. Evaluation of investment attractiveness of the Project
2.4.9. Sensitivity analysis of the Project
2.5. RISK ANALYSIS
2.5.1. Factor analysis of project risks
2.5.1.1. Risks of loss of profits and consumer risks
2.5.1.2. Resource risk and implementation
2.5.1.3. Bureaucratic and administrative risks
2.5.1.4. Financial risks
2.5.2. Risk reduction strategies
2.6. SWOT-analysis
3. CONCLUSIONS
4. NOTES
Applications:
Appendix 1. Aggregates for Project
Appendix 2. Project Settings
Appendix 3. Sources of financing and the total cost of the Project
Appendix 4. Agricultural Technology for the Project
Appendix 5. The project implementation schedule and funding sources
Appendix 6. Repayment of the loan and the payment of interest on the Project
Appendix 7. Service Schedule Credit for Project
Appendix 8. The calculation of depreciation for the Project
Appendix 9. Staffing for the Project
Appendix 10. Costing of the cultivation of grain (wheat, barley, corn)
Appendix 11. Sales Plan
Appendix 12. Projected profit and loss statement for the Project
Appendix 13. Projected statement of cash flows
Appendix 14. Diagram of operating expenses and income for the Project
Appendix 15. Budget balance
Appendix 16. Formation profit
Appendix 17. Break-even 2-7 years
Appendix 18. The calculation of the internal rate of return for the Project
Appendix 19. The calculation of the performance of its project activities
Appendix 20. The discounted payback period
Appendix 21. The calculation of scenarios for business development
Appendix 22. Evaluation scenarios for business
List of Tables:
Table 1 . Project Summary
Table 2. Destinations investment
Table 3. General Settings on the Project
Table 4. Price parameters of the elevator
Table 5. Taxation Project
Table 6. Equipment elevator
Table 7. Total cost of equipment elevator
Table 8. Staffing the Project
Table 9. The balance of supply and demand of grain in Ukraine 2008/2009 and MG 2009/2010 MG tons
Table 10. The balance of supply and demand of the world market of cereals 2008/2009 and MG 2009/2010 MG Mt
Table 11. Grouping regions of Ukraine by region
Table 12. The structure of grain exports by countries importing
Table 13. The largest private owners of grain elevators in Ukraine
Table 14. The location of elevators
Table 15. Formation profit Project
Table 16. Operating expenses for the project
Table 17. The size of the direct cost of service elevator
Table 18. and sampling schedule of loan repayment
Table 19. Ratio DSCR
Table 20. Performance Indicators
Table 21. The sensitivity of the project to change the prices for services elevator
Table 22. The sensitivity of the project to reduce congestion elevator
Table 23. Sensitivity to changes in the cost of the project
Table 24. SWOT-analysis
List of graphs and charts:
Figure 1. Destinations ща investment
Figure 2. Financial schedule of the project
Figure 3. Location of the Project
Figure 4. Organizational Project
Figure 5. Dynamics of production of grain in Ukraine, 2006-2010,, Kt
Figure 6. The share of grain production by region, 2009/2010 MG
Figure 7. The structure of sown areas in regions of Ukraine
Figure 8. Dynamics of the acreage of grain 2005-2010,, ha
Figure 9. Export Structure of grain for the 2009/2010 MG
Figure 10. Dynamics of grain prices in 2006-2010, UAH / t
Figure 11. The structure of the location of elevators in regions of Ukraine
Figure 12. The share of income from services for the types of services
Figure 13. and revenue costs of the project
Figure 14. Dynamics of net income and return on sales
Figure 15. Formation of the net profit on the project
Figure 16. Operating expenses
Figure 17. The structure of the direct cost of service elevator
Figure 18. Chart loan service
Figure 19. The dynamics of debt-servicing ratios for the project
Figure 20. Schedule breakeven Project
Figure 21. The internal rate of return
Figure 22. Payback Project
Figure 23. Correlation of NPV and the prices of services elevator
Figure 24. Correlation of NPV and congestion elevator
Figure 25. Correlation of NPV and cost of service elevator
