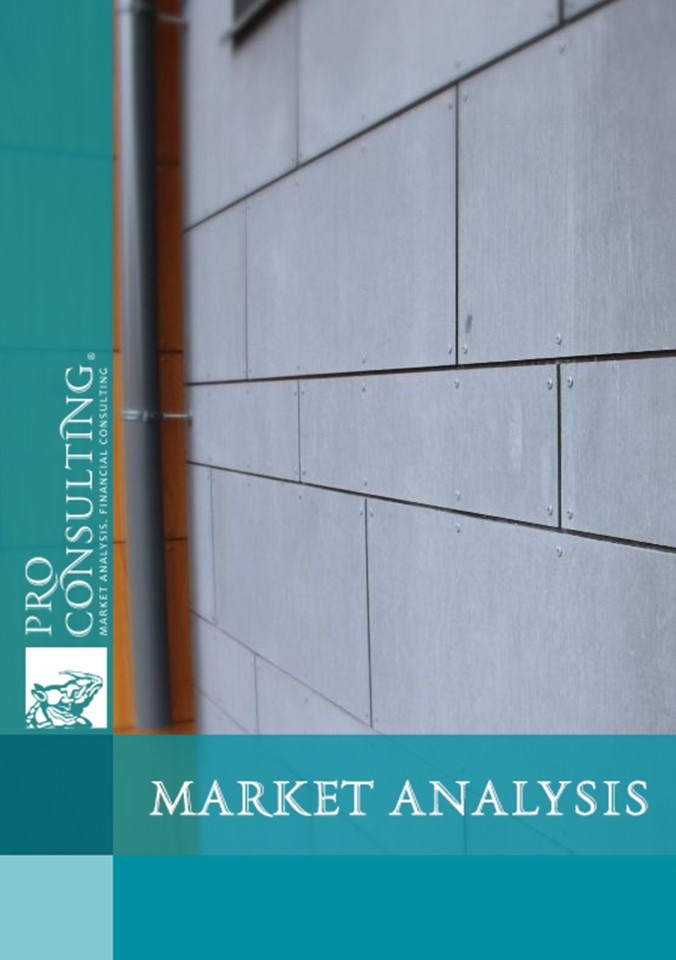
Market research report on fibre cement market in Ukraine, Lithuania and Poland. 2023 year
| Date of Preparation: | May 2023 year |
| Number of pages: | 38, Arial, 1 spacing, 10 pt |
| Graphs and charts: | 17 |
| Tables: | 33 |
| Payment method: | prepayment |
| Production method: | e-mail or courier electronically or in printed form |
| Report language: | ukrainian, russian, english |
- This report can be updated and customized based on your business goals; you can also purchase part of report (no less than 50%) at a more affordable price
- Failed to find your market research report? - contact us
- You can also order feasibility study and business plan for your business idea


Detailed contents:
1. General characteristics of the market
1.1. Market description (description of technology and alternatives, applications and characteristics)
1.2. Analysis of market development trends (factors of influence, development problems) - both construction in general and fibre cement in particular; by country
1.3. General market indicators, estimation of market capacity in 2019-2022 by country
1.4. Segmentation and structuring of the market (allocation of the fibre cement market share, by origin) in each country
2. Key market operators (manufacturers and importers)
2.1. List of the main market operators and their structure (general information, types of activity and specialisation; product groups, brands and assortment; regional representation)
2.2. Market shares of the main operators (estimate)
2.3. Degree of competition and risks. Factor analysis of competitors' market shares
3. Domestic production in 2019-2022.
4. Foreign trade in the market
4.1 Exports of fibre cement boards from the countries under study in 2019-2022 (volume)
4.2. Imports of fibre cement boards to Ukraine in 2019-2022 (volume)
5. The range of products presented on the market (building assortment maps to determine the saturation of market segments): interior, facade boards, specific properties of goods
6. Price and pricing in the market
6.1. Average current prices for products
6.2. Comparison of fibre cement boards prices with prices of alternative materials
7. Branding and advertising (analysis of competitors' positioning in the market, presence in promotion channels) - analysis of the promotion of fibre cement boards as a product and companies as suppliers
8. Analysis of consumption in the market
8.1. Analysis of construction development trends in countries
8.2. Key indicators of the construction industry
8.3. Companies that use fibre cement boards in their activities
8.4. Structuring and segmentation of consumption (by type of real estate)
9. Conclusions. Forecast indicators of the market
9.1. Conclusions and forecast trends in the market development
9.2. Building hypotheses of market development. Forecast indicators of market development in 2023-25
9.3. Recommendations for market development
10. Investment attractiveness of the industry
10.1. SWOT analysis of the Customer's company in the market
10.2. PEST LE - analysis of factors of influence on the market
10.3. Existing risks and barriers to market entry. Building a risk map in the market
List of Tables:
1. Programme Plan of the Long-term Renewal Strategy until 2050 in Poland
2. Key indicators of the fibre cement market in Ukraine in 2019-2022 in physical terms, thousand tonnes
3. Key indicators of the fibre cement market in Poland in 2019-2022 in physical terms, thousand tonnes
4. Key indicators of the fibre cement market in Lithuania in 2019-2022 in physical terms, thousand tonnes
5. The main operators of the fibre cement market in Ukraine, Poland and Lithuania
6. Imports and market shares of the main operators in the fibre cement market in Ukraine, 2022
7. Factor analysis of market share dynamics
8. Assortment map of fibre cement boards by size in Ukraine
9. Assortment map of fibre cement boards by type in Ukraine
10. Product range of fibre cement boards by size in Poland
11. Product mix of fibre cement boards by type in Poland
12. Product range of fibre cement boards by size in Lithuania
13. Product mix of fibre cement boards by type in Lithuania
14. Average current prices for fibre cement boards in Ukraine, USD per m2
15. Average current prices for fibre cement boards in Poland, USD per m2
16. Average current prices for fibre cement boards in Lithuania, USD per m2
17. Comparison of prices for fibre cement boards with prices for alternative materials in Ukraine, USD per m2
18. Comparison of prices for fibre cement boards with prices for alternative materials in Poland, USD per m2
19. Comparison of prices for fibre cement boards with prices for alternative materials in Lithuania, USD per m2
20. Dynamics of the volume and share of construction in the GDP of Ukraine
21. The volume of construction products by type in 2019-2022 in monetary terms, $ billion
22. The area of residential buildings at the beginning of construction by type in 2019-2022 in physical terms, thousand m2
23. Dynamics of the volume and share of construction in Poland's GDP
24. Forms of housing delivered in 2021-2022 by form of construction in Poland
25. New buildings commissioned in 2022 by type of building and construction technology in Poland
26. Dynamics of the volume and share of construction in GDP in Lithuania
27. The volume of commissioned residential premises and their usable area in 2019-2022 in Lithuania
28. The volume of new non-residential premises in 2019-2022 in Lithuania
29. Companies that use fibre cement boards in their activities
30. SWOT-analysis of the company PJSC "Ivano-FrankivskCement"
31. PEST LE matrix - analysis of factors influencing the fibre cement market in Ukraine, Poland and Lithuania
32. Segmentation of market risks
33. Risk map of the fibre cement market in Ukraine, Poland and Lithuania
List of graphs and charts:
1. Structure of the fibre cement market by type in Ukraine, %.
2. Structure of the fibre cement market by thickness in Ukraine, % 3.
3. Structure of the fibre cement market by type in Poland, % 4.
4. Structure of the fibre cement market by thickness in Poland, %.
5. Structure of the fibre cement market by type in Lithuania, % 6.
6. Structure of the fibre cement market by thickness in Lithuania, %.
7. Market shares of the main market operators in physical terms in terms of imports to Ukraine in 2022, %.
8. Dynamics of fibre cement boards production in Ukraine in 2019-2022 in physical terms
9. Dynamics of exports of fibre cement boards from Ukraine in 2019-2022 in physical terms, t
10. Dynamics of exports of fibre cement boards from Poland in 2019-2022 in physical terms, thousand tonnes
11. Dynamics of fibre cement boards exports from Lithuania in 2019-2022 in physical terms, thousand tonnes
12. Dynamics of exports of fibre cement boards from Ukraine in 2019-2022 in monetary terms, USD thousand
13. Dynamics of exports of fibre cement boards from Poland in 2019-2022 in monetary terms, $ million
14. Dynamics of exports of fibre cement boards from Lithuania in 2019-2022 in monetary terms, USD million
15. Dynamics of imports of fibre cement boards to Ukraine in 2019-2022 in physical terms, thousand tonnes
16. Dynamics of imports of fibre cement boards to Ukraine in 2019-2022 in monetary terms, $ million
17. Forecast indicators of market capacity in Ukraine in physical terms, thousand tonnes
