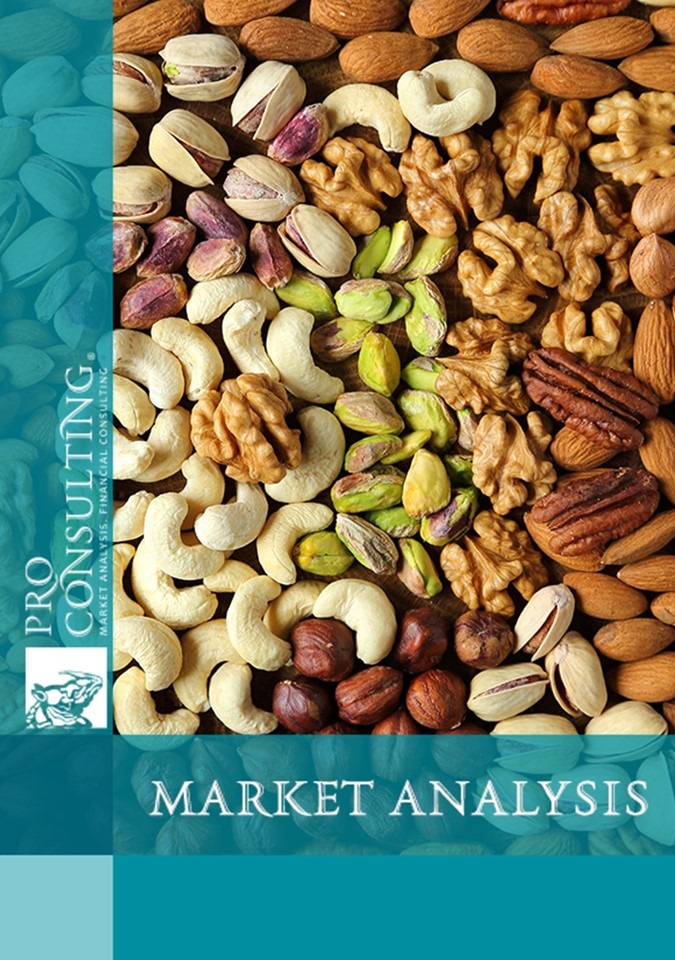
Market research report on global almond market. 2022 year

| Date of Preparation: | July 2022 year |
| Number of pages: | 33, Arial, 1 interval, 10 pt |
| Graphs and charts: | 3 |
| Tables: | 39 |
| Payment method: | prepayment |
| Production method: | e-mail or courier electronically or in printed form |
| Report language: | ukrainian, russian, english |
- This report can be updated and customized based on your business goals; you can also purchase part of report (no less than 50%) at a more affordable price
- Failed to find your market research report? - contact us
- You can also order feasibility study and business plan for your business idea


Detailed contents:
1. General characteristics of the market
1.1. Analysis of market development trends (global trends in the almond market, local trends, factors influencing the market, import duty when supplied from Azerbaijan)
1.2. General market indicators. The volume of almond consumption in the studied countries in 2017-2021. (Production + import - export)
1.3. Market segmentation and structuring
2. Analysis of domestic cultivation and processing of almonds in the studied countries in 2017-2021.
3. Main market operators (importers, manufacturers, packers)
3.1. List of the main market operators and their characteristics (types of activity and specialization; product groups, brands and assortment, company news)
3.2. Nature of competition and risks (analysis of market forces in the market)
4. Foreign trade on the almond market of the studied countries
4.1. Export of almonds in 2017-2021. (Volumes, prices, geography)
4.2. Import of almonds in 2017-2021. (Volumes, prices, geography)
5. Assortment and pricing on the market
5.1. The assortment of products presented on the market (construction of the assortment matrix for each country by types of goods and saturation of each assortment group)
5.2. Average current prices for almonds (at retail, taking into account the features of retail packaging)
5.3. Description of factors affecting price formation, structure
6. Analysis of consumption over the market. Comparison of almond consumption per capita in the studied countries. Comparison with consumption of other nuts in other countries
7. Conclusions. Predictive indicators
7.1. Conclusions and forecast trends of almond market development of the studied countries
7.2. Construction of market development hypotheses. Forecast indicators of market development in 2022-2023.
7.3. Recommendations for market development
8. Investment attractiveness of the industry
8.1. SWOT analysis of the almond market
8.2. PESTLE analysis of factors affecting the market (in general with specifics by country)
8.3. Existing risks and barriers to market entry. Construction of a risk map for the studied market
List of Tables:
1. The volume of consumption of peeled almonds in the studied countries in 2017-2021, thousand tons
2. Share of peeled almonds produced in the studied countries, %
3. Portion of peeled almonds sold at retail.
4. Portion of packaged blanched almonds sold at retail
5. Volume of almond cultivation in the studied countries in 2017-2020, thousand tons
6. The main operators of the almond market
7. The main parameters of evaluating the competitive environment in the market according to M. Porter's method
8. Evaluation of the competitive environment in the market of peeled almonds of the studied state
9. Results of the assessment of the competitive environment in the market of peeled almonds of the studied countries
10. Export volume of peeled almonds in 2017-2021, thousand tons
11. Geography of export of peeled almonds from Poland in volume terms, thousand tons
12. Geography of exports of peeled almonds from the UAE in volume terms, thousand tons
13. Geography of exports of peeled almonds from Turkey in volume terms, thousand tons
14. Average export prices for peeled almonds per 100 g.
15. Import volume of peeled almonds in 2017-2021, thousand tons
16. Geography of imports of peeled almonds in the UAE in volume terms, thousand tons
17. Geography of imports of peeled almonds to Turkey in volume terms, thousand tons
18. Geography of import of peeled almonds to Kazakhstan in volume terms, thousand tons
19. Geography of imports of peeled almonds to India in volume terms, thousand tons
20. Geography of import of peeled almonds in volume terms, thousand tons
21. Geography of imports of peeled almonds to Saudi Arabia in volume terms, thousand tons
22. Geography of imports of peeled almonds to Poland in volume terms, thousand tons
23. Geography of import of peeled almonds to Azerbaijan in volume terms, thousand tons
24. Average import prices for peeled almonds per 100 hryvnias. $
25. Assortment matrix by types of almonds of India
26. Assortment matrix by types of almonds in Kazakhstan
27. Assortment matrix by types of almonds in Turkey
28. Assortment matrix by types of almonds in Poland
29. Assortment matrix by types of almonds to
30. Assortment matrix by types of almonds in Saudi Arabia
31. Assortment matrix by types of almonds in the UAE
32. General assortment matrix by types of almonds in the studied countries
33. Average current prices for almonds in the studied countries in value terms, USD.
34. Price difference between dried and processed almonds in the almond market in $ and %
35. Forecasted market capacity of peeled almonds of the studied countries in 2022-2023.
36. Preference of countries by types of almond processing and packaging options
37. SWOT analysis of the peeled almond market by analyzed countries
38. PESTLE analysis of factors affecting the peeled almond market
39. Risk map of the shelled almond market of the studied countries
List of graphs and charts:
1. Sales volume of almonds in the world 20217-2021, million tons
2. Consumption of almonds per capita in the studied countries, kg
3. Forecasted world production of almonds in 2022-2023, million tons

