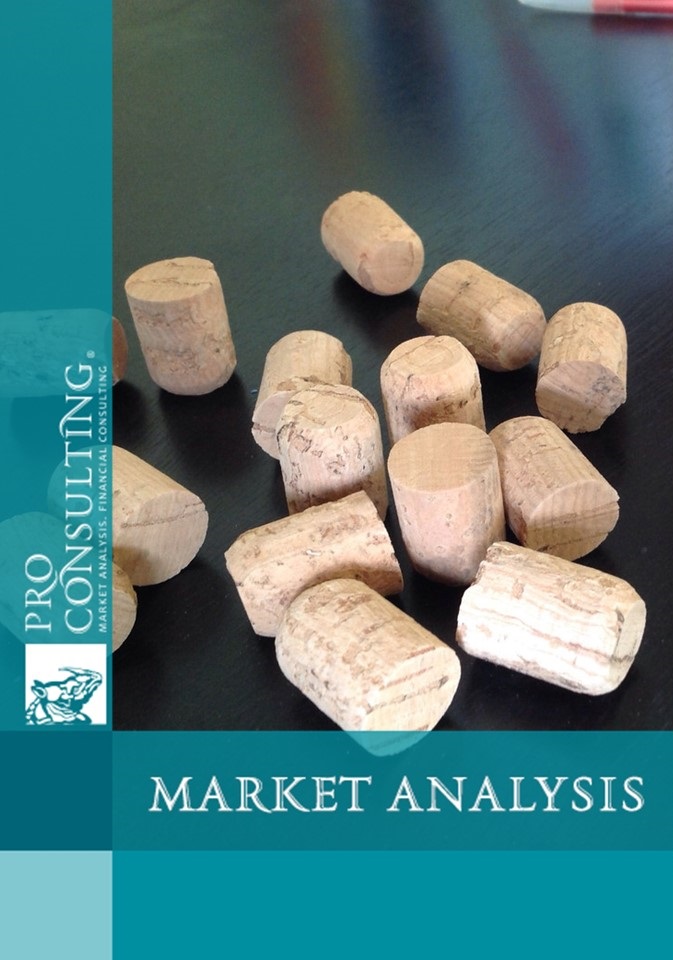
Market research cork in Ukraine. 2013

General characteristics
| Date of Preparation: | March 2013 year |
| Number of pages: | 0, Arial, 1 interval, 10 font |
| Graphs and charts: | 11 |
| Tables: | 4 |
| Payment method: | prepayment |
| Production method: | e-mail or courier electronically or in printed form |
- This report can be updated and customized based on your business goals; you can also purchase part of report (no less than 50%) at a more affordable price
- Failed to find your market research report? - contact us
- You can also order feasibility study and business plan for your business idea


Detailed contents:
1. Market capacity of cork. Development trends.
2. The market structure of cork Ukraine.
3. Operators in the market of Ukraine cork.
4. Dynamics of prices for cork stoppers in Ukraine.
5. Conclusions. Forward-looking indicators of market development cork Ukraine.
List of Tables:
1. The volume of production of cognac, wines and sparkling wines in Ukraine in 2008-2012. in real terms
2. Market capacity of cork in Ukraine in 2008-2012. in real terms, tons
3. The dynamics of the market price of natural cork in Ukraine in 2008-2012., U.S. $ per 1 kg
4. The market price of natural cork in Ukraine, depending on its use in 2011-2012., U.S. $ per 1 kg
List of graphs and charts:
1. Dynamics of production of cognac, champagne and sparkling wines in Ukraine in 2008-2012. in real terms.
2. The dynamics of the market capacity cork in Ukraine in 2008-2012. in real terms, tons
3. The dynamics of the market capacity cork in Ukraine in 2008-2012. in terms of money, thousands of dollars
4. Regional pattern of import of natural cork to Ukraine in 2012 in real and monetary terms,%
5. The market structure of cork in Ukraine for use in 2011 in real and monetary terms,%
6. The market structure of cork in Ukraine for use in 2012 in real and monetary terms,%
7. The market structure of cork in Ukraine by the type of crust in 2008-2012. in real terms,%
8. The market structure of cork in Ukraine by the type of crust in 2008-2012. in monetary terms,%
9. Shares of major market operators cork in Ukraine in 2012 in physical and monetary terms,%
10. The dynamics of the market price of natural cork in Ukraine in 2008-2012., U.S. $ per 1 kg
11. Capacity forecast cork in Ukraine in 2012-2016 years. in real terms, tons